Creating a Vyatta parser for ELSA
ELSA or Enterprise Log Search and Archive to give it it's full title is a centralised log management solution. Similar to Splunk in principal; it provides google-like searching, graphing, dashboards and alerts. ELSA is extraordinarily easy to install and get up and running, just follow the quick-start guide.
Searching in ELSA is incredibly fast; Martin Holste, ELSA's creator, went to amazing lengths to ensure that it was not only fast but exceptionally scalable as well. In order to meet those design goals Martin knew that using regex to parse log data would be way too slow, so ELSA uses Syslog-ng and Pattern DB to receive and categorise events.
For more information watch Martin's presentation entitled Perl for Big data on youtube.
ELSA has numerous parsers built into it including Snort, Windows, Apache, Cisco, Check Point and many others, so you might find that your log source is already supported. However, I wanted to add Vyatta Community Edition firewall logs to ELSA and in order to do that I needed to create a new parser.
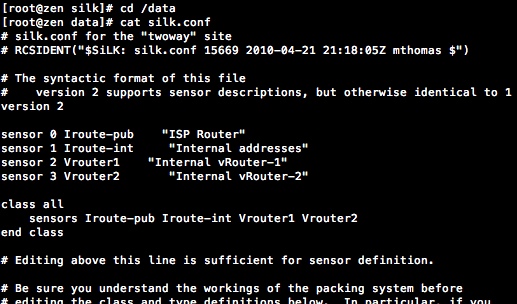
As I've mentioned in previous posts I use Vyatta community edition as a router and firewall in my test lab. I really like Vyatta for its comprehensive feature set and its easy command-line syntax. And it works brilliantly under VMware.
Pattern DB uses a simple syntax to break up the log data and parse it into fields so that it can be searched easily but before I get to that I need to understand which class I want to add the Vyatta firewall logs to in ELSA.
ELSA uses a class to categorise data feeds. You can use an existing class in ELSA or create your own. In this case I wanted to use two existing classes for firewall traffic that is denied and permitted. The two classes in ELSA are FIREWALL_ACCESS_DENY and FIREWALL_CONNECTION_END.

The screenshot shows the FIREWALL_ACCESS_DENY class and it's associated fields. The field order is significant and you need to know this order to create the parser in Pattern DB. At the bottom of the screenshot an unparsed Vyatta log entry can be seen. Notice the program=kernel is shown, this is the identifying tag (the syslog facility) that ELSA has pulled from the log line. When I create the parser this is used to identify all the messages that should be parsed.
To summarise, so far I have:
- Class: FIREWALL_ACCESS_DENY
- Proto
- srcip
- srcport
- dstip
- dstport
- o_int
- i_int
- access_group
- Class: FIREWALL_CONNECTION_END
- Proto
- srcip
- srcport
- dstip
- dstport
- conn_bytes
- o_int
- i_int
- conn_duration
- Program: kernel
It's easy to look in the MySQL ELSA tables to check that the information I have collected is correct and to gain one additional piece of information I need to to create my parser. The following SQL statements show each of the fields used for the classes FIREWALL_ACCESS_DENY and FIREWALL_CONNECTION_END.
The output is shown below: The last piece of information I need is the field type as the placeholders for the parser need to reflect the type in the DB table.
Paste the SQL output into a spreadsheet and add a Token column. In the Token column number each integer and string field type starting from the lowest value and numbered from 0. The first int field is i0 and the next i1 and so on, the same for each string starting from s0. This will be used in the parser so that the field parsed is assigned to the correct field in the database. The spreadsheet above shows the Token values I added.
Edit PatternDB.XML
The final part is create the parser. Each parser consists of a ruleset followed by a pattern which identify the log lines that should be evaluated in this case program=kernel. This is followed by rules and a rule which specifies a provider, class and ID. The class and id is 2 for FIREWALL_ACCESS_DENY and 3 for FIREWALL_CONNECTION_END. The next section is Pattern or Patterns if you have more than one to apply. Next the Patterns are applied to each log line matching 'kernel'.Take a look at the parsers already in the /usr/local/elsa/node/conf/patterndb.xml or if using ELSA on Security Onion /opt/elsa/node/conf/patterndb.xml. It's a good idea to examine the patterndb.xml to familiarise yourself with the structure and see some other examples. Each new parser needs to be added between the 'patterndb' Pattern DB start and end tags. Each line in the 'Patterns' section represents a potential Pattern match for various forms of the log line. Examining the first Pattern shows how strings are matched positionally using both string-literal matches and dynamically using QSTRING, ANYSTRING, NUMBER, IPv4 and ESTRING keywords. All keywords start and end with an @ symbol.
@QSTRING::[]@ [@ESTRING:s2:-A]@ IN=@ESTRING:s1: @OUT=@ESTRING:s0: @@ESTRING::SRC=@@IPv4:i1:@ DST=@IPv4:i3:@ @ESTRING::PROTO=@@ESTRING:i0: @SPT=@ESTRING:i2: @DPT=@ESTRING:i4: @@ANYSTRING@
- @QSTRING::[]@
- [@ESTRING:s2:-A]@
- IN=@ESTRING:s1: @
- OUT=@ESTRING:s0: @
- @ESTRING::SRC=@
- DST=@IPv4:i3:@
- @ESTRING::PROTO=@
- SPT=@ESTRING:i2: @
- @ANYSTRING@
More information on the syntax is available here.
If you need to create your own ELSA Class follow the instructions on 'Adding Parsers' on the Documentation Wiki.
Testing the parser
The parser can be tested using the 'pdbtool' command line tool. An example can be added to check each log line variant with the 'examples' section in the patterndb.xml above. Alternatively you can test a single log line with pdbtool using the -M flag. Note that the examples here are from Security Onion and that the path to the patterndb.xml is different from the regular ELSA install '/usr/local/elsa/node/conf/patterndb.xml'.If there are no errors from the testing then it's good to go.
The screenshot below shows Vyatta firewall log data in ELSA.


Comments
Post a Comment